
Meeting the rising demand for skilled tech workers
Predicting stock value. Improving health care outcomes. Recommending a movie or TV show for you to watch this weekend. Data analysts develop and work with tools that perform these functions and more.
Once confined to the finance and tech industries, people with the skills to aggregate and make sense of data are in demand in virtually all industries around the world, with predictions of at least an 11 percent job growth in the United States into 2024. Postings for data science jobs increased 75% from January 2015 to January 2018, according to online employment service Indeed.
The University of Minnesota’s Data Visualization and Analytics Certificate was developed to meet that demand. It’s a 24-week, boot camp-style program offered through the College of Continuing and Professional Studies in collaboration with Trilogy Education Services.
“Never before has it been more important to have the right data available to the right people at the right time,” says Brian Torkkola, the College’s program director for professional development. “Some experts are predicting that the expansion of artificial intelligence will create more than 130 million new roles in fields that include data science.”
Taught by Working Experts
David Kreitzer and Kamran Wali are recent graduates of the program. They were impressed by the rigorous training and the expertise of the instructors.
Postings for data science jobs rose by 75% from January 2015 to January 2018. —Indeed

Kreitzer, who has been a product manager for software development projects and has done software testing, was looking to acquire data analytics skills. He didn’t want to do it online and he was looking for the credibility that getting a certificate from the University of Minnesota would lend.
“We had great instructors. They were data scientists by day who understood not just textbook concepts but how they are applied daily,” says Kreitzer. He says the instructors taught them how to take complex data and render it in a visually accessible format that can be understood by “non-tech people.”
Wali has been collecting data for 15 years as a senior developer for the U’s Office of Information Technology. He was interested in learning how to take the next step and tell a story with data. He says they started with the basics—Excel and paper tables—before moving on to more complex programming and data analytics tools.
“It was 250 hours of no-nonsense software training, with 20–30 hours additional work outside the classroom. You literally didn’t have a choice but to be good,” says Wali. “The beauty of it was that we were not on our own. The instructors were all professionals, all doing that work in their daily lives.”

Students aren’t the only ones who got a lot out of the program. Paul Kaefer, a data scientist with UnitedHealth Group and one of the instructors, said, "While there were challenges teaching a boot camp that met for 10 class hours per week on top of having a full-time job, it was a very fulfilling experience. I enjoyed teaching and have been enthusiastic to introduce students to contacts within my company and at other companies in the Twin Cities."
Hands-On Training
The program aims to teach hard skills that translate to good jobs. Coursework consists of hands-on training using real datasets from finance, health care, government, social welfare, and more. Graduates complete the program with a portfolio of real projects to present to employers.
"The U of M's boot camp provides an intensive deep dive into software being used prolifically in the field of data science,” says Kaefer. “Whether students coming to the program are completely new to computer programming or have some analytical background, they will gain skills and experience with new technologies that will better prepare them for roles analyzing big data."
The course consists of 512 in-class activities, which the instructor would explain and the students would then practice and get immediate feedback. In addition, there were three big projects they chose themselves, along with 16 homework assignments. For one of the homework assignments, Kreitzer gathered the most recent 100 tweets from five media outlets as part of what’s called a sentiment analysis. It’s a type of opinion mining to gauge people’s opinions at a point in time, such as during an election cycle.
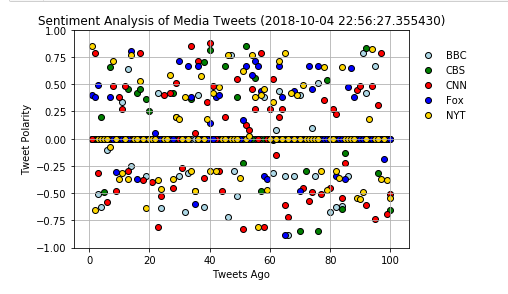
“This was a great project because we were able to use two of the important skills we learned: scraping tweets and analyzing data with a sentiment analysis library,” says Kreitzer.
Wali’s final project was to investigate a correlation between the closing price of a stock and the future price, among other relationships. “A lot of what we learned is how to display the data visually, how to take a mess of data, use math models to clean up noise, and show a trend,” he says.
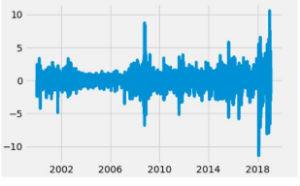
|
He and his group started by taking the difference between stock prices at the daily level. |
|
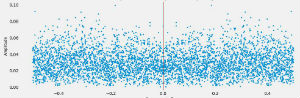
Using an algorithm to convert frequency to a series of data points, they got the next iteration, a noisy point cloud. |
|
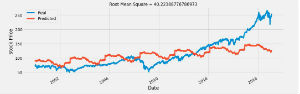
The final result, after more calculations and conversions, is a graph that shows the trends, both real and predicted, of stock price over time. |
What’s Next?
Kreitzer and Wali graduated from the Data Visualization and Analytics Certificate, along with 45 others, in March, each with enhanced skills and renewed ambitions. Krietzer says his journey into the world of data analysis is just beginning. He’s most interested in machine learning and remains open to employment possibilities. Wali is looking into quantitative analysis work, potentially in a research capacity. “I came out with really good experience and a network of true professionals,” says Wali. “These guys were real humans.”
For more information about this and other CCAPS professional development courses and certificate programs, visit our website.